World Cities Summit 2012
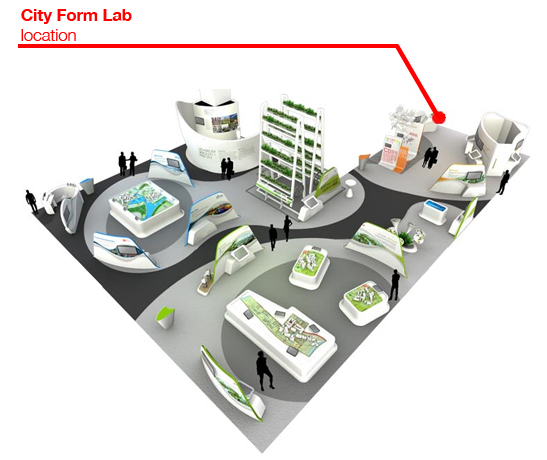
World Cities Summit Exhibit
The 20th century has produced more urban fabric than millennia before. After half a century of explosive growth, however, urban design has hardly looked back and studied how well different design solutions that are now in use actually work. There is even less knowledge about the workings of city environments that have emerged on their own, with little or no planning and professional guidance. Yet the latter often constitute the most interesting, and in many rapidly urbanizing regions, the most pervasive qualities of a city.
The City Form Lab uses empirical spatial analysis as a technique for discovering these urbanistic qualities of the contemporary city. All cities contain volumes of information about their physical form – the two and three-dimensional pattern of buildings, public spaces and paths that connect them – as well as the dynamic interactions of people, goods and information that take place therein. These data can allow us to better understand how cities work, how people use them, and how the human interactions they facilitate may turn into social, economic, and environmental rewards. Combined with focused questions and analytic methods, analysis can turn into potentially operational knowledge and help address fundamental questions of good city design. Can the form of the built environment facilitate equitable access to the city’s resources? Does the spatial configuration of a neighborhood affect the economic performance of it enterprises? How does the layout of a city affect our perception of its quality, its livability?
A meaningful analysis of a contemporary city demands a multi-scalar approach, where buildings can be understood with respect to the activities and institutions they accommodate on the one hand, and linked to a broader neighborhood- or city-wide system of interrelationships on the other. Single buildings are now as complex as entire districts of the past, and neighborhoods connected through digital infrastructure as much as physical infrastructure. Developing a better understanding of how such urban conditions operate, and how physical changes can affect their workings, is the new frontier that the urban designer of the 21st century will have to confront.
The works of the City Form Lab shown at the World Cities Summit exhibit explore this quest by using new spatial data and analytic methods that can help cities and their stakeholders make better-informed decisions in their planning.
Project team: Raul Kalvo, Onur Ekmekci, Reza Amindarbari, Faye Nixon, Andres Sevtsuk.
Download CFL Exhibit Press Release.
Project team: Raul Kalvo, Onur Ekmekci, Reza Amindarbari, Faye Nixon, Andres Sevtsuk.
Download CFL Exhibit Press Release.
Postcards
A series of postcards describing Singapore as viewed through spatial analysis were distributed to visitors at the exhibit. These postcards can be downloaded as PDFs in the following:
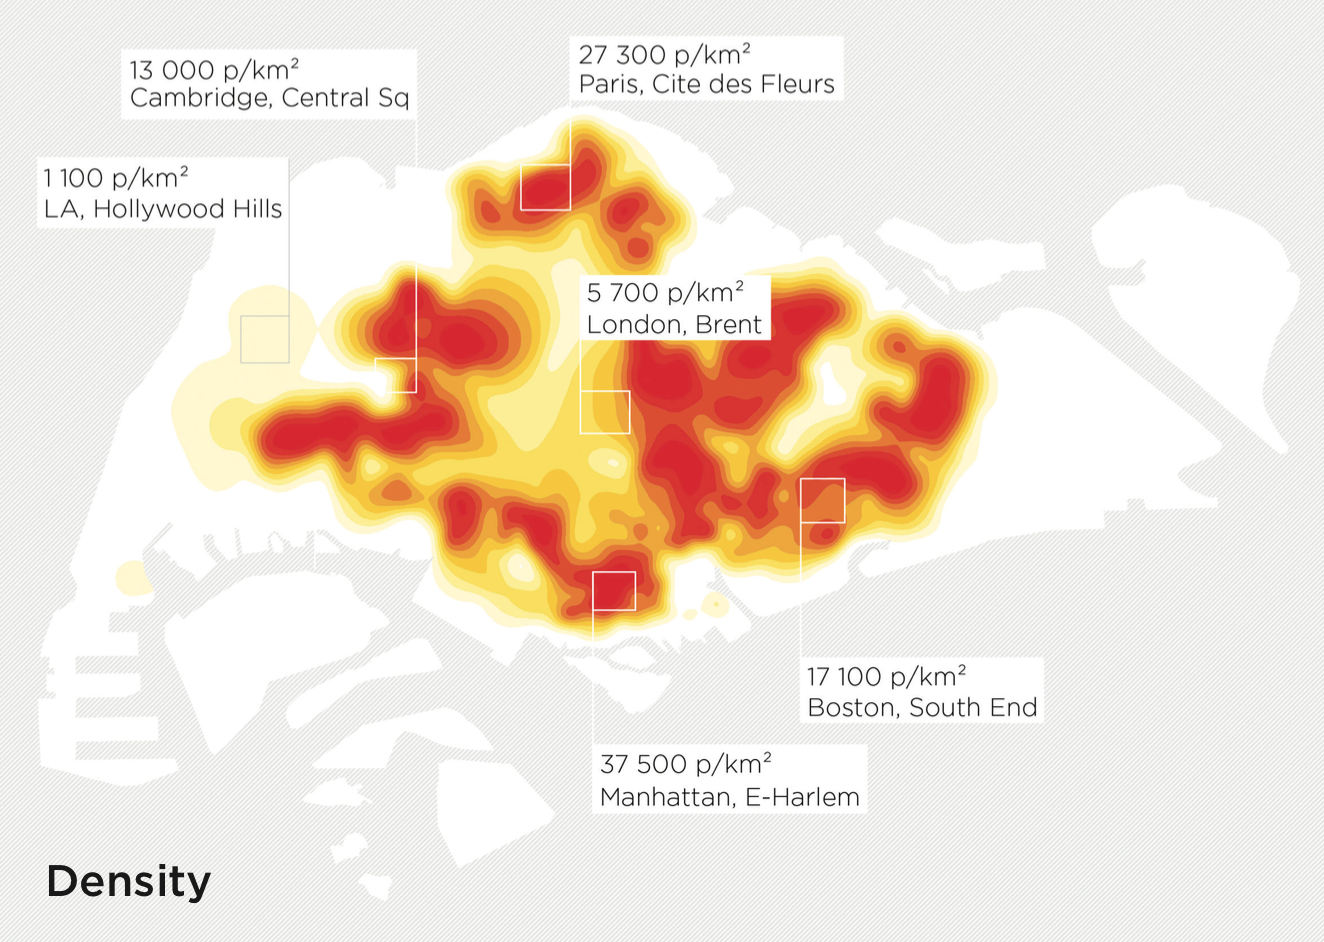
Density: The heat map illustrates variations in population density across Singapore island. The overall population density is 7 405 p/km2 (2011), but local peaks diverge significant above and below the mean.
Beyond public transit: Singapore’s extensive public transit network of subways, light-rails and buses reaches most of the developed areas of the city. But island-wide, even larger areas remains beyond walking distance from public transit. These areas, which are spatially intertwined with highly urban Singapore, include reserves and hinterland functions that form an integral part of the metropolis. Green areas of the map indicates places that require a ten or more minutes walk from nearest bus stops and a twenty or more minute walk from the nearest MRT stations.
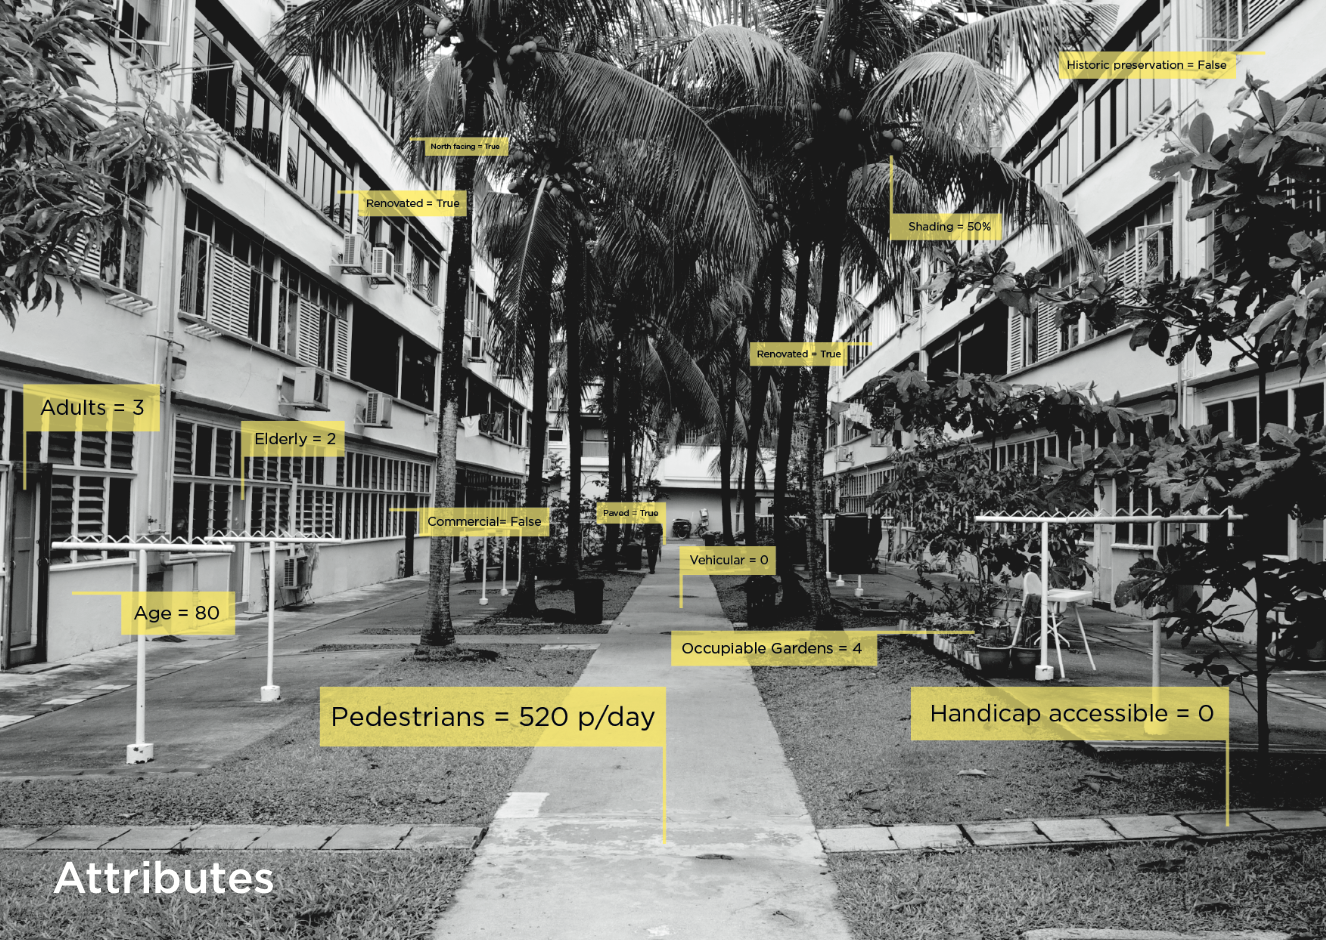
Attributes: How can a complex built environment be described in numbers? The photograph illustrates selected qualities of a pedestrian alley in Singapore’s Tiong Bahru Estate. The spatial attributes described on labels can be used as attributes of a spatial network model of the area.
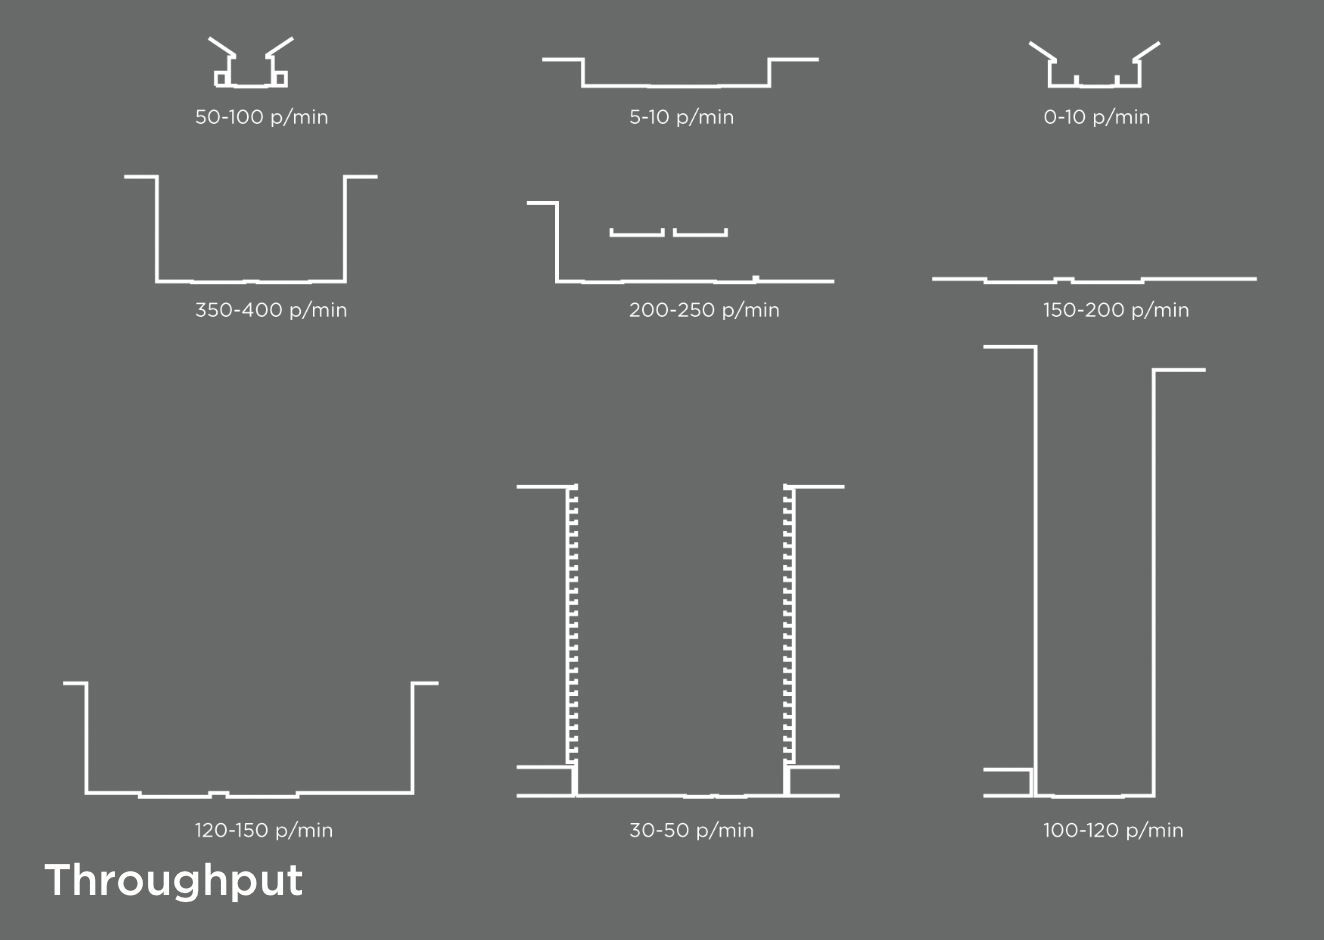
Throughput: The sections illustrate common street typologies found in the urban form of Singapore. The amount of people that each type of street typically ac- commodates varies by location as well as mode of travel. Whereas spacious expressways can process 40 vehicles per minute, pedestrian streets in dense downtown areas can have double that throughput at lower speeds.
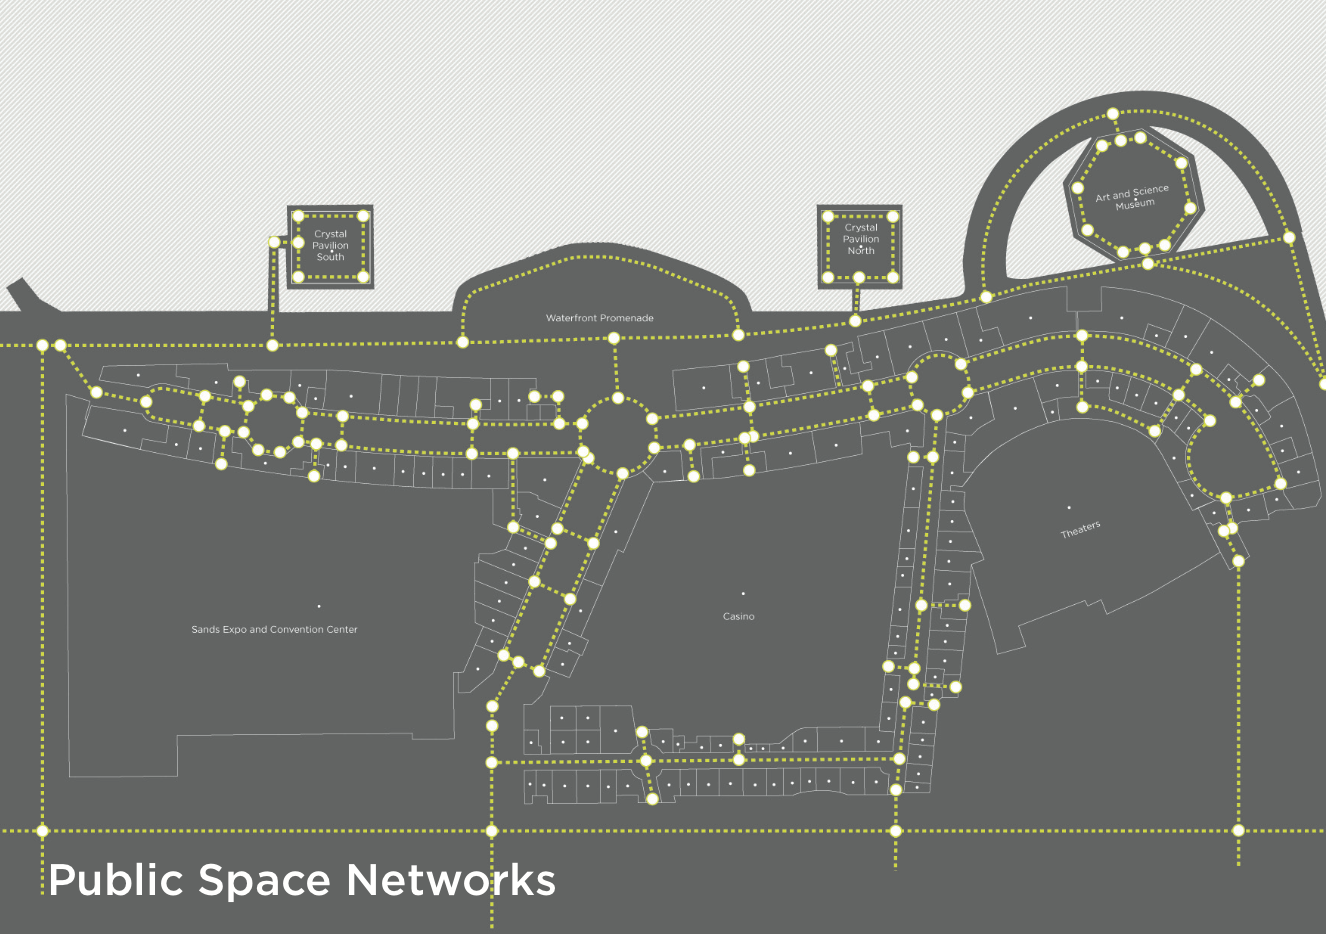
Public Space Networks: The map illustrates the publicly accessible pedestrian networks in and aournd the Marina Bay Sands shopping arcades in Singapore. A large share of occupiable public space in contemporary cities is indoors. The Urban Network Analysis framework can be used to represent both indoor and outdoor envi- ronments in a seamless continuum that closely corresponds to the experience of a contemporary city.
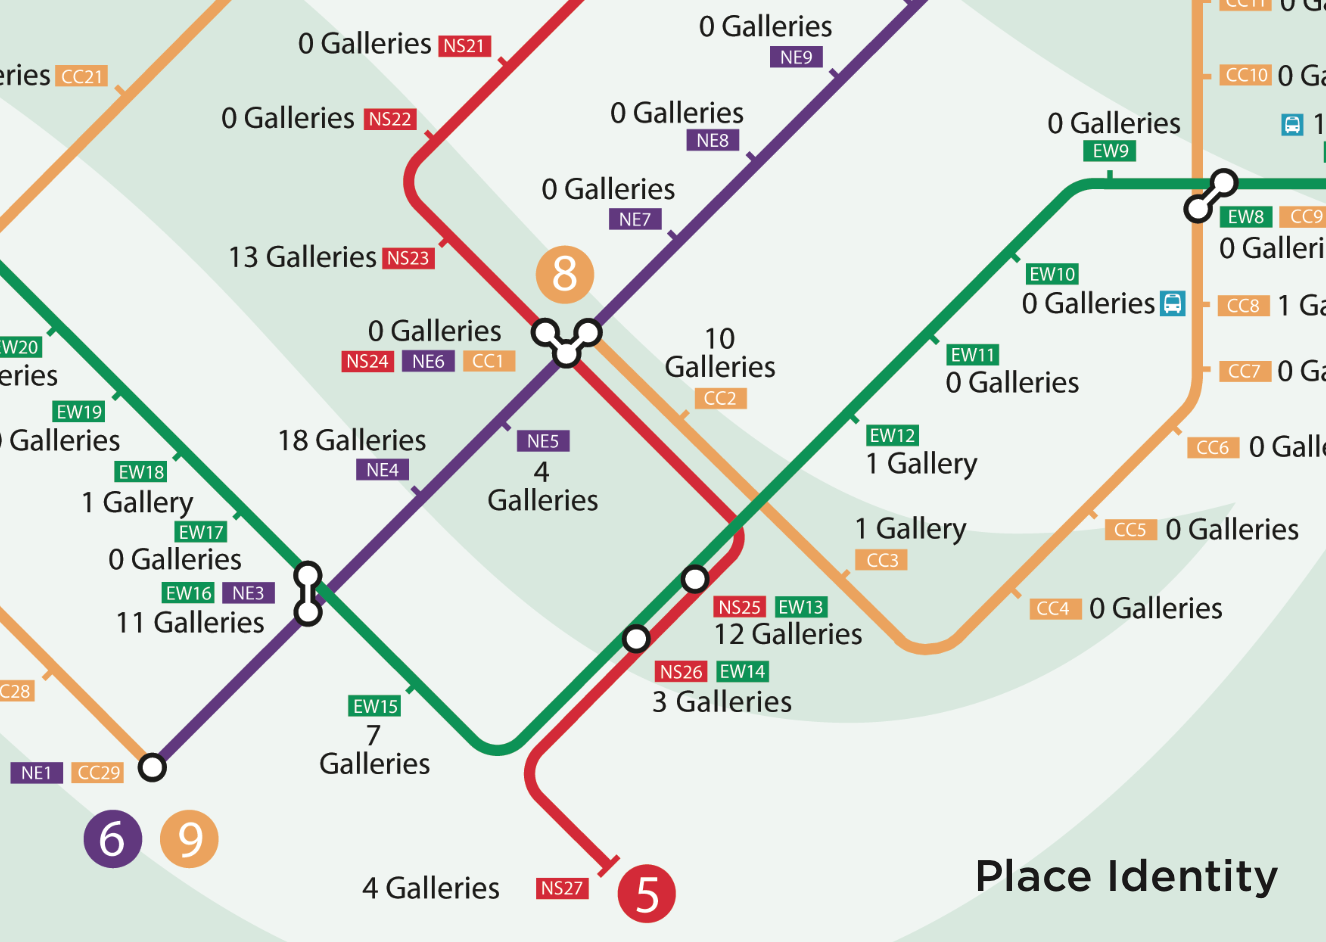
Place Identity: What gives identity to a city’s neighborhoods? This map illustrates the number of art galleries that are found within a ten-minute walking radius around central MRT stations in Singapore.
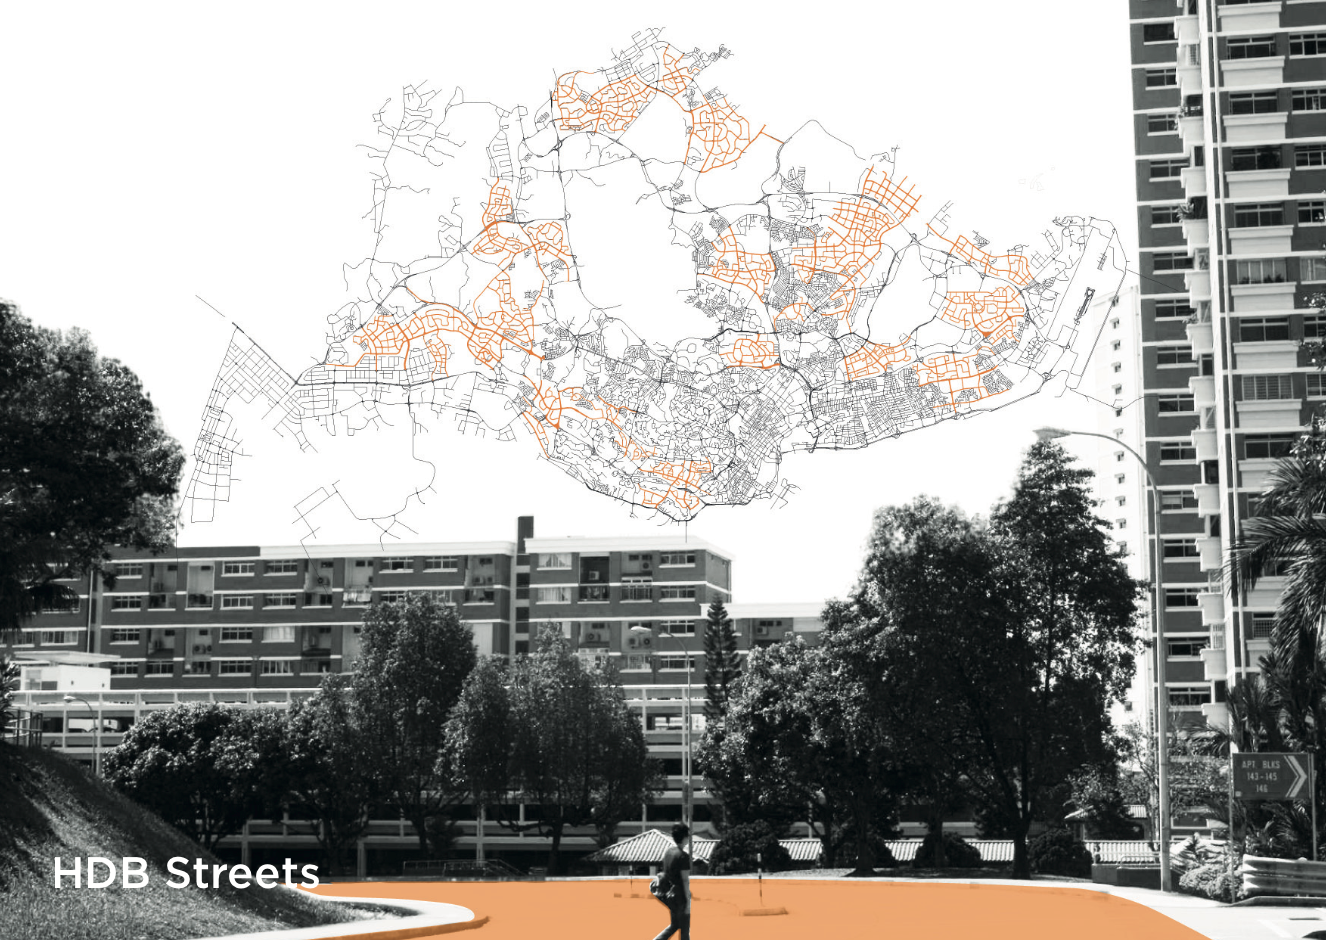
HDB Streets: Map illustrating the extent of streets within HDB developments in the overall street network of Singapore.
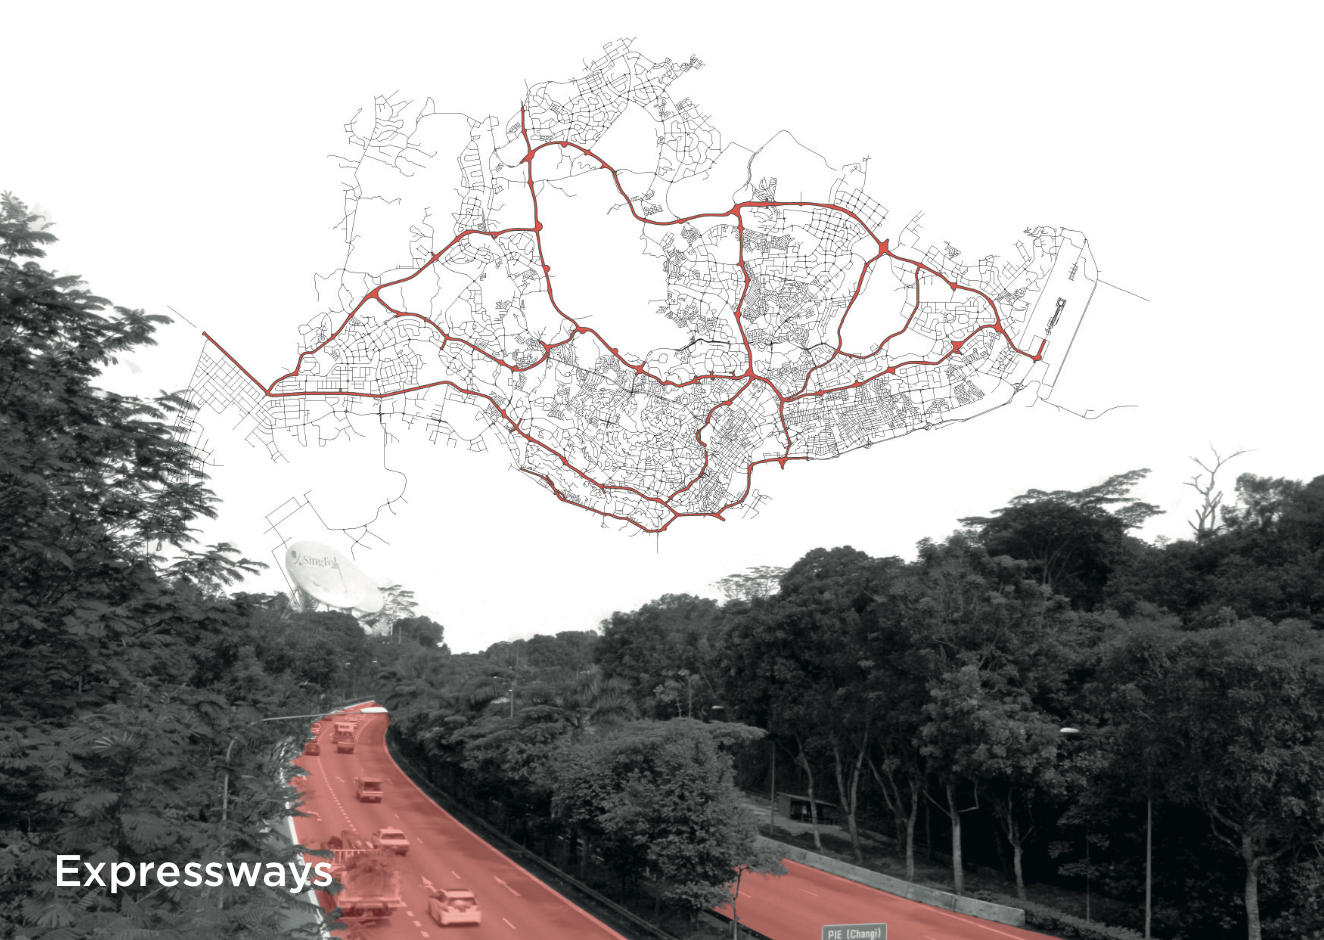
Expressways: Map illustrating the extent of vehicular expressways in the overall street network of Singapore.
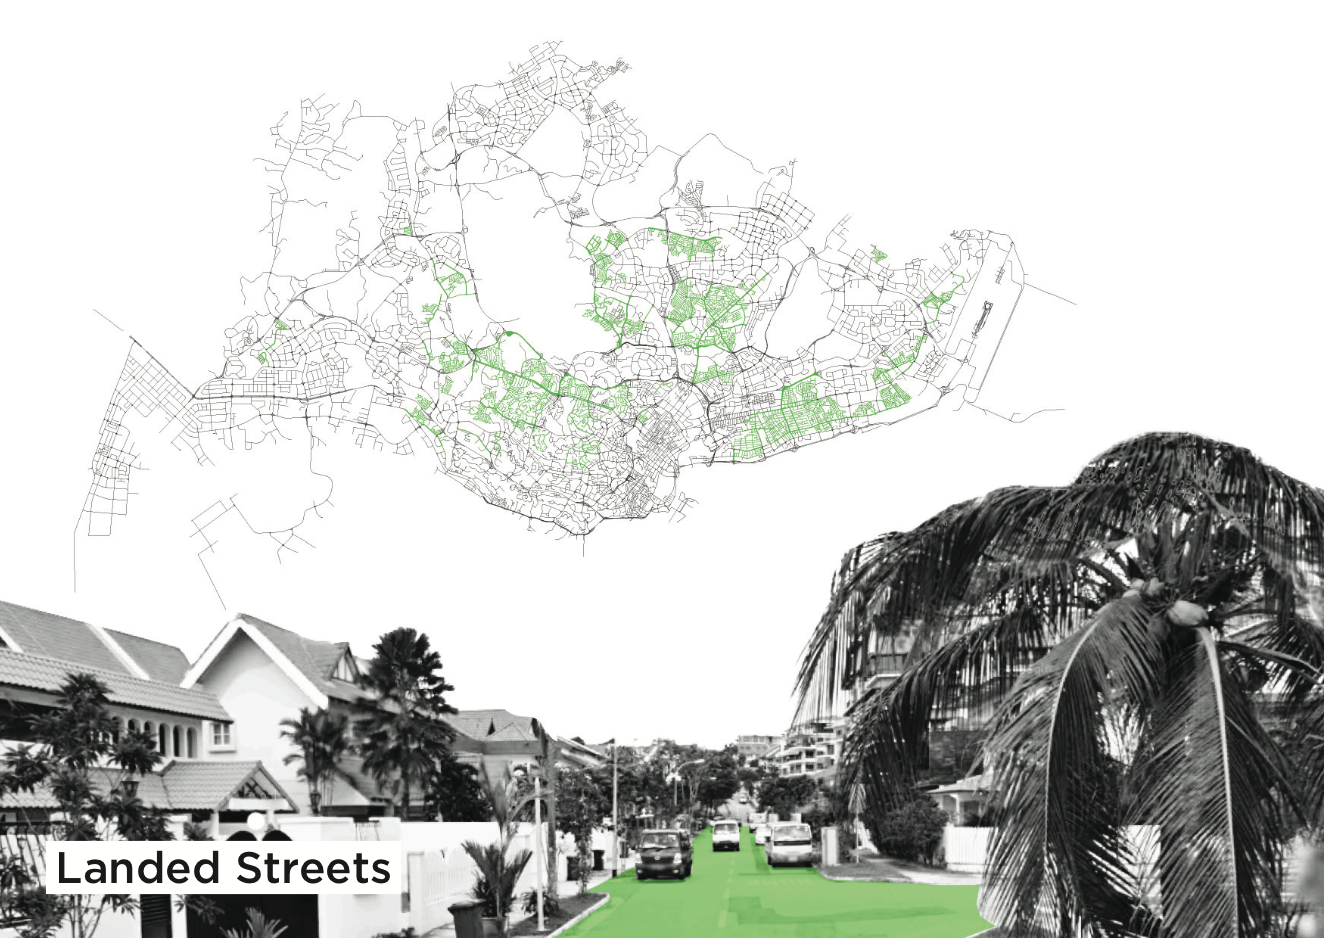
Landed Housing Streets: Map illustrating the extent of landed residential streets in the overall street network of Singapore.
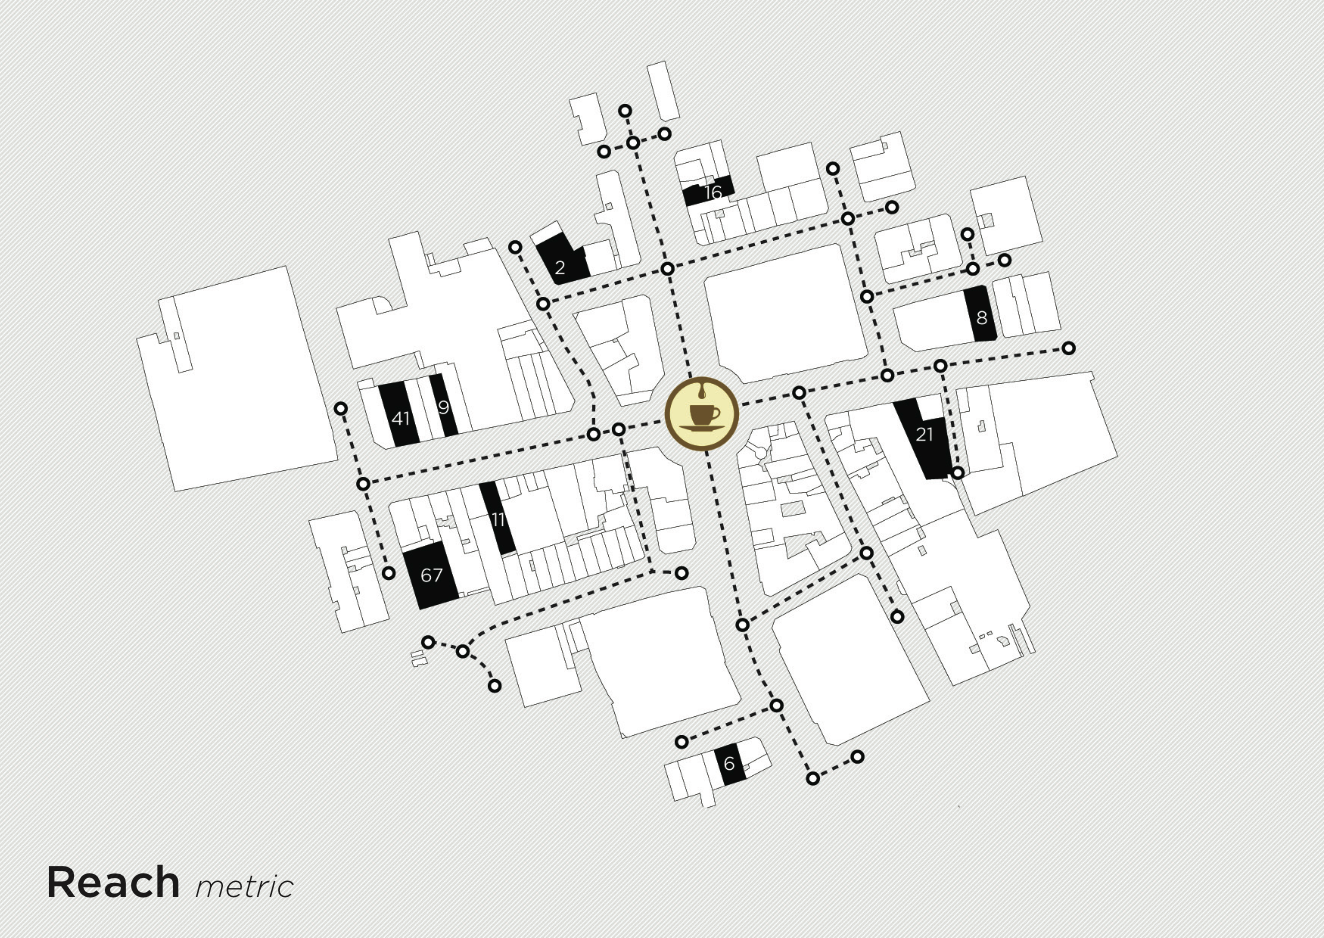
Reach metric: The Reach metric is a network analysis measure that captures the number of destinations that can be reached around a place within a given travel radius. Reach can be specified to summarize accessibility to any kind of destination – people of a certain type, buildings, firms, transit stations etc.– and the travel radius can be specified for different travel modes, such as walking, driving, biking or public transit.
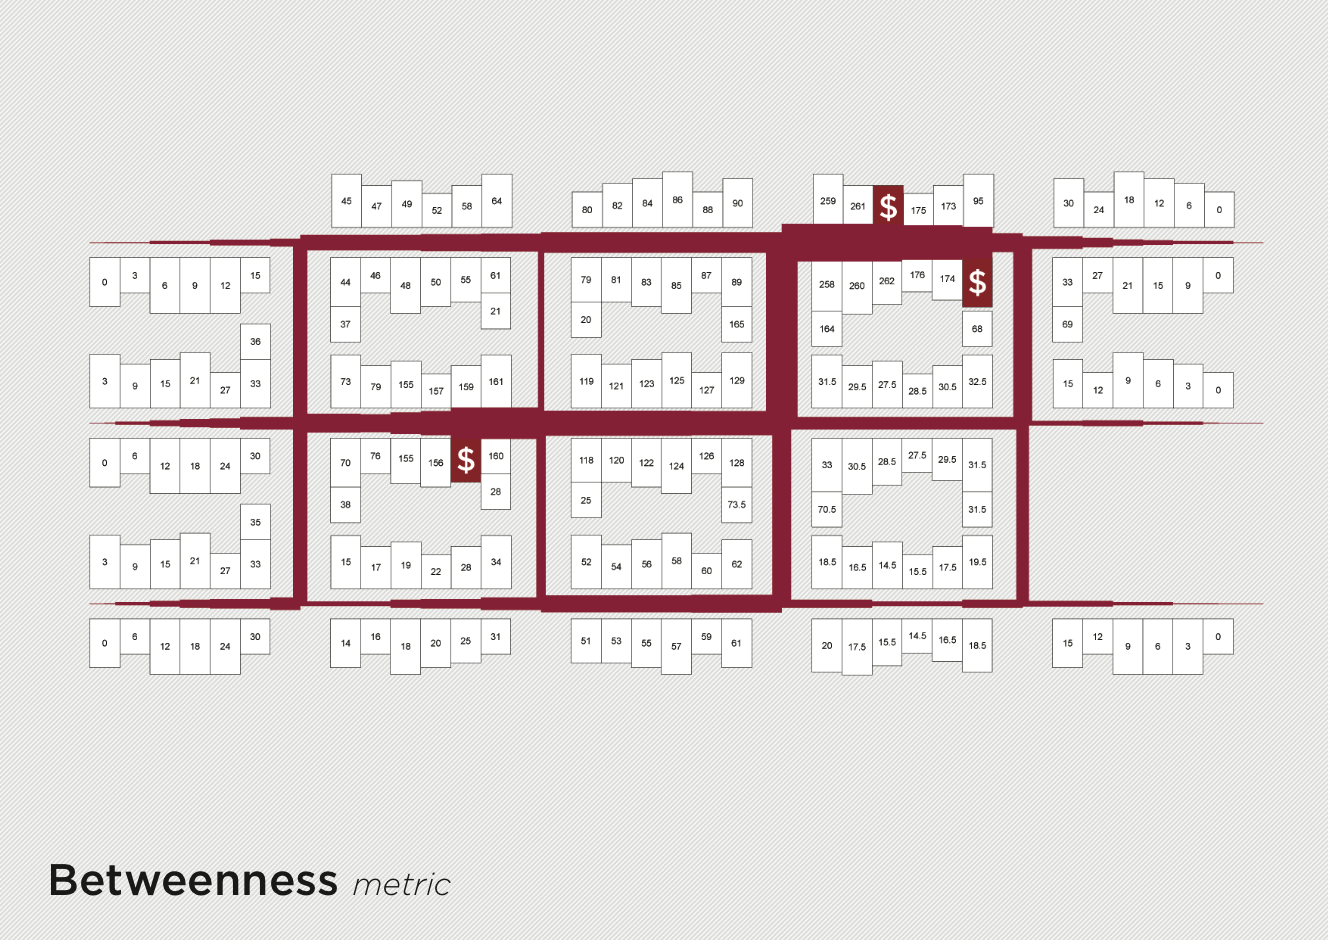
Betweenness metric: The Betweenness metric is a network analysis measure that can be used to estimate traffic patterns in a city. The index describes the number of shortest-path trips between surrounding origins and destinations that pass by each building. The cover map illustrates the number of pedestrian trips that would pass by each building if one inhabitant from every building would walk to the three shown destinations along shortest paths.
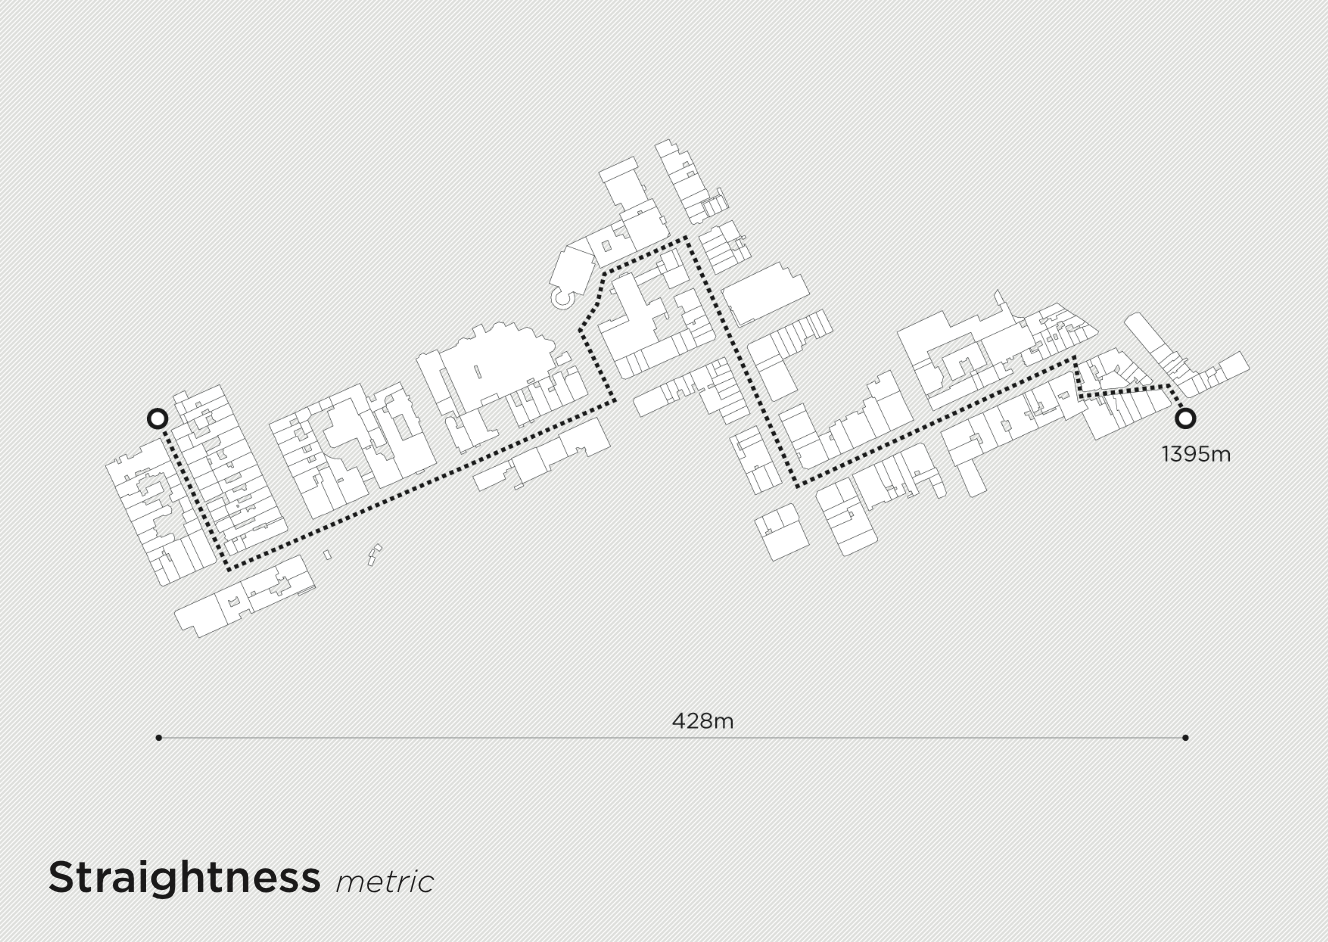
Straightness metric: The Straightness metric is a network analysis measure that describes how much the available network routes between locations diverge from the straight-line distance between the same locations. Locations with higher Straightness values reach most of the destinations around them without detours.